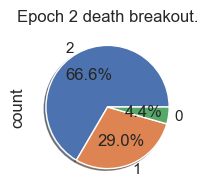
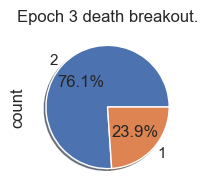
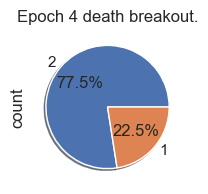
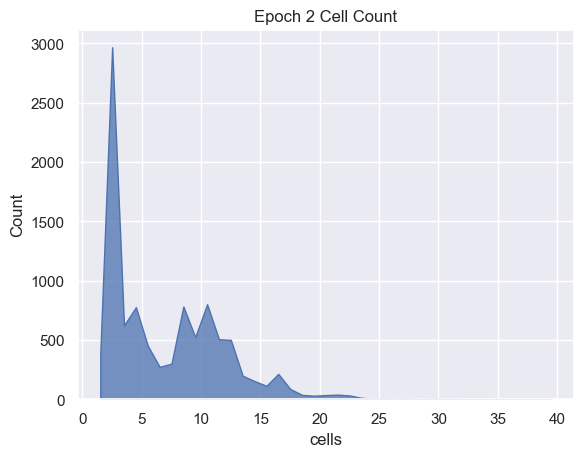
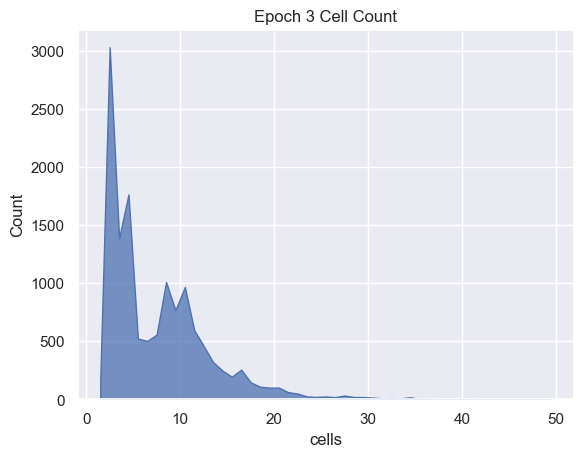
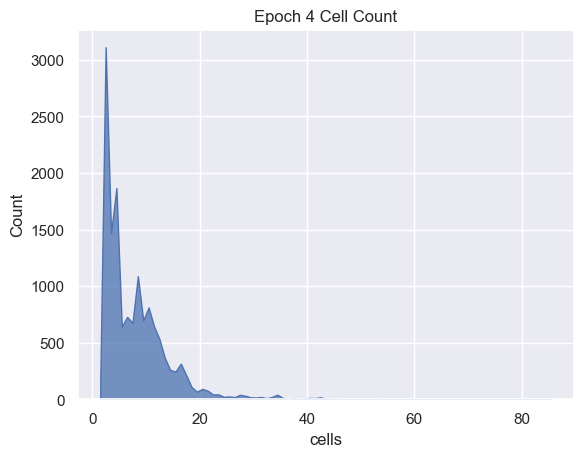
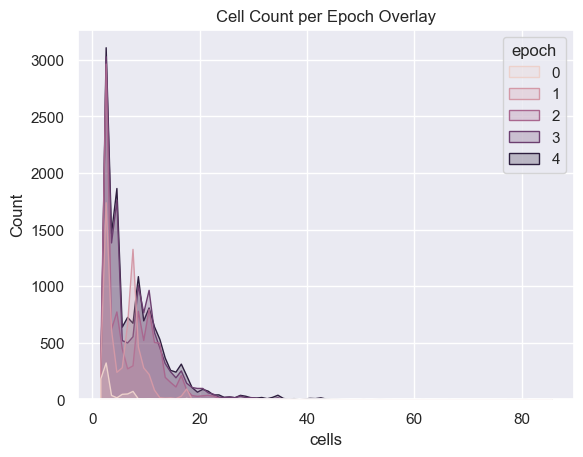
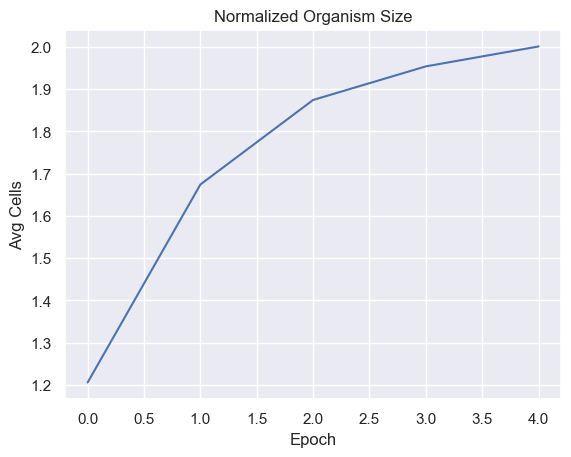
Fitness, cell count, and offspring counts trend positive over multiple generations and epochs. Currently no organism is reaching old age. Death type tends towards exhaustion over time.
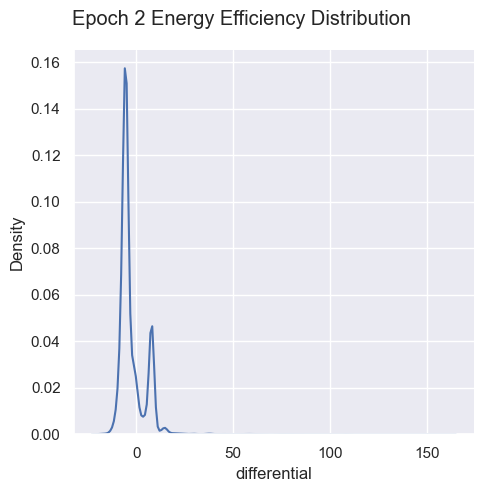
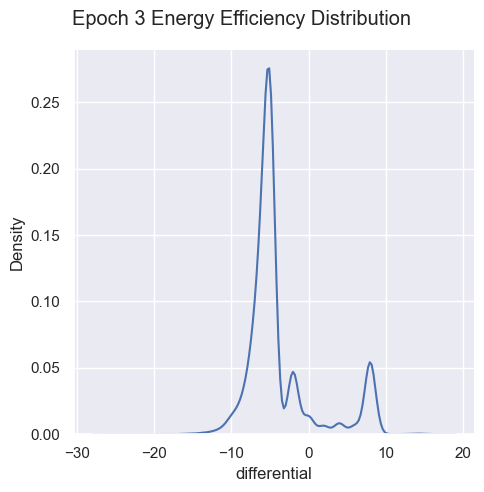
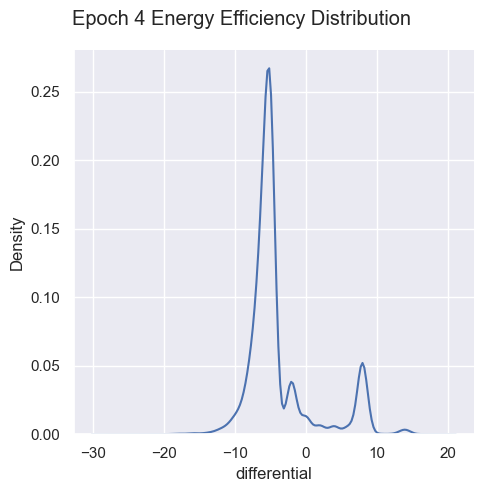
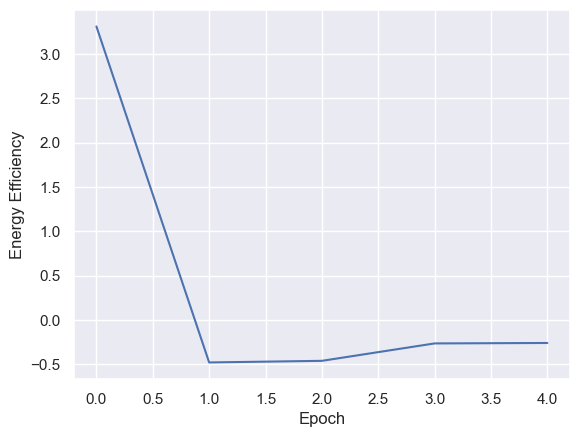
Energy efficiency may not be a valuable metric. Since there are no selection pressures on energy efficiency other than starvation and exhaustion, it is unclear if there are trends emerging over generations. Energy waste was removed from the fitness function as it’s strongly correlated with energy efficiency, essentially doubling the energy efficiency impact on fitness.
Population Death Offspring Energy Efficiency Cells
1
2
3
4
5
| import pandas as pd
import json
import seaborn as sns
import matplotlib.pyplot as plt
import math
|
1
2
3
4
5
6
7
8
9
10
11
12
13
| total_epochs = 5
performance_path = '/Users/luke/dev/Genetics/data/Rebalanced-Sim4-Epoch-%d-performance.json'
environment_path = '/Users/luke/dev/Genetics/data/Rebalanced-Sim4-Epoch-%d-environment.json'
metrics = [
{
'metric': 'performance',
'path': performance_path
},
{
'metric': 'environment',
'path': environment_path
}
]
|
1
2
3
4
5
6
7
8
9
10
11
12
13
14
15
16
17
18
19
20
21
22
| def genetic_data_to_dataframe(path):
raw_df = pd.read_json(path)
return pd.json_normalize(raw_df['log'])
def load_simulation_data():
simulations = {}
for metric in metrics:
if not metric['metric'] in simulations:
simulations[metric['metric']] = {}
for i in range(total_epochs):
simulation_instance = genetic_data_to_dataframe( metric['path'] % i )
simulation_instance['epoch'] = i
simulations[metric['metric']][i] = simulation_instance
return simulations
def merge_epochs(df):
cat_df = pd.DataFrame();
for i in range(total_epochs):
cat_df = pd.concat( [ df[i], cat_df] )
return cat_df
|
1
2
3
| sns.set_theme(style="darkgrid")
simulations = load_simulation_data()
|
Death ID Mappings
| ID | Death |
|---|
| 0 | Unknown |
| 1 | Stagnation |
| 2 | Exhaustion |
| 3 | Old Age |
Population Over Time
1
2
3
4
| all_environment_data = merge_epochs( simulations['environment'] )
fig = sns.lineplot(x="tickCount", y="totalOrganisms", hue='epoch',
data=all_environment_data ).set_title("Population Over Time")
|
Fitness Analysis
1
2
3
4
5
6
7
8
9
10
| all_organism_data = merge_epochs( simulations['performance'] )
g = sns.relplot(
data=all_organism_data,
x="birthTick", y="fitness", hue="epoch"
)
g.set(xlabel="Birth", ylabel="Fitness", title="Organism Fitness")
g.despine(left=True, bottom=True)
g.fig.set_size_inches(15,15)
|
1
2
3
4
5
6
| fitnessPerEpoch = pd.DataFrame(columns=['epoch', 'fitness' ])
for i in range(total_epochs):
fitnessPerEpoch.loc[ -1 ] = [ i , simulations['performance'][i]['fitness'].mean() ]
fitnessPerEpoch.index = fitnessPerEpoch.index + 1
g = sns.lineplot(x="epoch", y="fitness", data=fitnessPerEpoch).set_title("Mean Fitness per Epoch")
|
Death Analysis
1
2
3
4
5
6
7
8
9
| palette_color = sns.color_palette('bright')
# plotting data on chart
for i in range(total_epochs):
simulations['performance'][i]['causeOfDeath'].value_counts().plot.pie( autopct='%1.1f%%', shadow=True, figsize=(2,2))
plt.title("Epoch " + str(i) + " death breakout.")
plt.show()
|
1
2
3
4
5
6
7
8
| causeOfDeathPerEpoch = pd.DataFrame(columns=['Epoch', 'Cause of Death' ])
for i in range(total_epochs):
simulations['performance'][i]['deathRating'] = simulations['performance'][i]['causeOfDeath'] / 4
causeOfDeathPerEpoch.loc[ -1 ] = [ i , simulations['performance'][i]['deathRating'].mean() ]
causeOfDeathPerEpoch.index = causeOfDeathPerEpoch.index + 1
g = sns.lineplot(x="Epoch", y="Cause of Death",
data=causeOfDeathPerEpoch).set_title("Morbid Rating ")
|
Offspring Analysis
1
2
3
4
5
6
7
8
9
10
11
12
| childrenPerEpoch = pd.DataFrame(columns=['Epoch', 'Avg Children' ])
for i in range(total_epochs):
childrenPerEpoch.loc[ -1 ] = [ i , math.log(simulations['performance'][i]['offspring'].mean()) ]
childrenPerEpoch.index = childrenPerEpoch.index + 1
sns.histplot( data=all_organism_data, x='offspring', hue='epoch', binwidth=1,
element="poly" ).set_title('Offspring Count per Epoch')
plt.show()
g = sns.lineplot(x="Epoch", y="Avg Children",
data=childrenPerEpoch).set_title("Normalized Average Children")
|
Energy Efficiency Analysis
1
2
3
4
5
6
7
8
9
10
11
12
13
14
15
16
17
18
19
| energyEfficiencyPerEpoch = pd.DataFrame(columns=['Epoch', 'Energy Efficiency' ])
for i in range(total_epochs):
simulations['performance'][i]['differential'] = simulations['performance'][i]['totalEnergyHarvested'] - simulations['performance'][i]['totalEnergyMetabolized']
simulations['performance'][i]['normalized'] = 1 / simulations['performance'][i]['differential']
energyEfficiencyPerEpoch.loc[ -1 ] = [ i , 1 / simulations['performance'][i]['differential'].mean() ]
energyEfficiencyPerEpoch.index = energyEfficiencyPerEpoch.index + 1
g = sns.displot( data=simulations['performance'][i], x="differential", kind="kde")
g.figure.subplots_adjust(top=.9);
g.figure.suptitle( 'Epoch ' + str(i) + ' Energy Efficiency Distribution')
plt.show()
g = sns.lineplot(x="Epoch", y="Energy Efficiency",
data=energyEfficiencyPerEpoch)
plt.show()
|
Cell Analysis
1
2
3
4
5
6
7
8
9
10
11
12
13
14
15
| cellsPerEpoch = pd.DataFrame(columns=['Epoch', 'Avg Cells' ])
for i in range(total_epochs):
cellsPerEpoch.loc[ -1 ] = [ i , math.log(simulations['performance'][i]['cells'].mean()) ]
cellsPerEpoch.index = cellsPerEpoch.index + 1
sns.histplot( data=simulations['performance'][i], x='cells', binwidth=1,
element="poly").set_title('Epoch ' + str(i) + ' Cell Count')
plt.show()
sns.histplot( data=all_organism_data, x='cells', hue='epoch', binwidth=1,
element="poly" ).set_title('Cell Count per Epoch Overlay')
plt.show()
sns.lineplot(x="Epoch", y="Avg Cells",
data=cellsPerEpoch).set_title("Normalized Organism Size")
plt.show()
|


