Simulation 5 Breakdown
Results
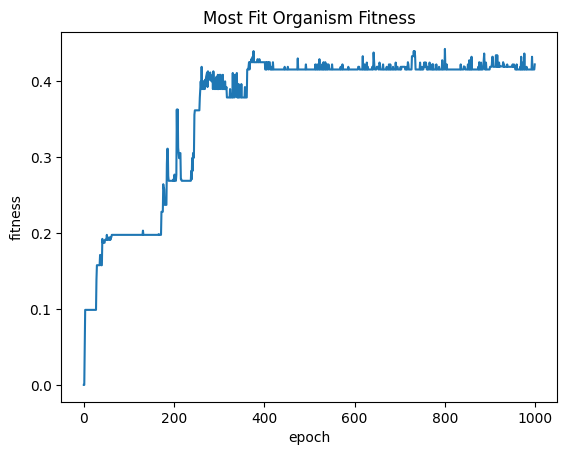
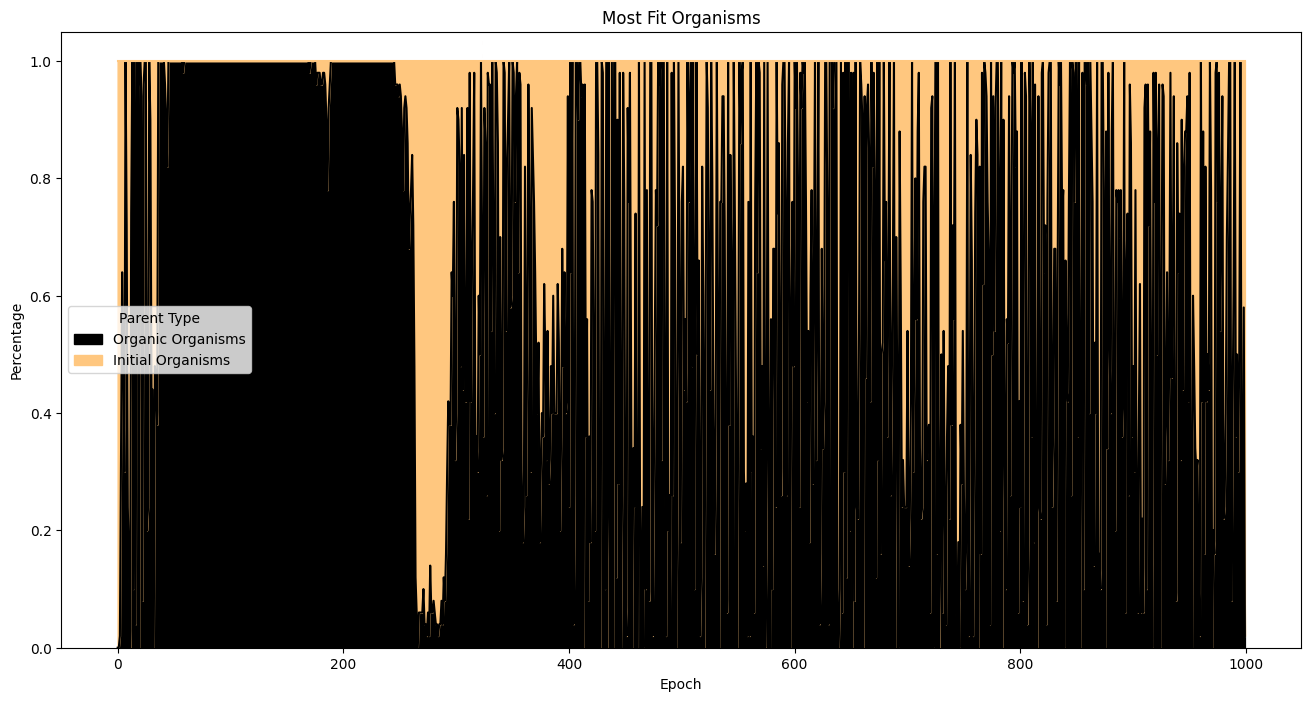
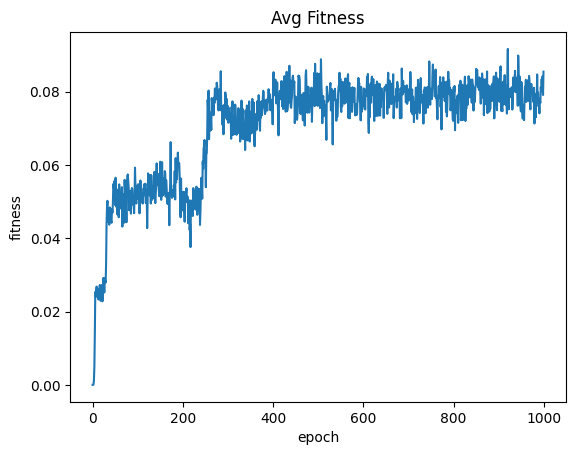
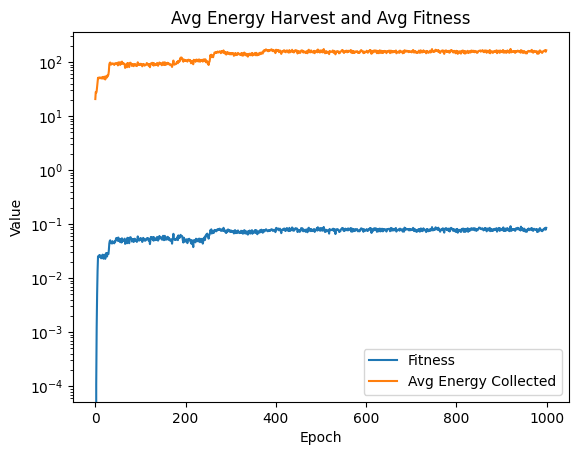
Organisms appear to reach maximum fitness by epoch 250 and then the trend levels off with some jitter. From epoch 0 to epoch 250, the majority of the most fit organisms are evolved from the starting population. After the approximate 250 - 300th epoch, the majority of the most fit organisms were part of the seeding population, which means further processing will not result in significant improvement to fitness. This is reflected in the average fitness per epoch.
A key error in this simulation is that it is not training itself but rather performing a random search across the domain space.
Method Declarations:
1
2
3
4
5
6
7
8
9
10
11
12
13
14
15
16
17
18
19
20
21
22
23
24
25
26
27
28
29
30
31
32
33
34
35
36
| import pandas as pd
import json
import seaborn as sns
import matplotlib.pyplot as plt
import math
import gzip
import os
def compareAvgMetricsByEpoch(dataframe, firstColumn, secondColumn ):
avgFirstColumnDf = sim5Data.groupby('epoch', as_index=False)[firstColumn].mean()
avgSecondColumnDf = sim5Data.groupby('epoch', as_index=False)[secondColumn].mean()
joinedData = pd.merge(avgFirstColumnDf, avgSecondColumnDf, on='epoch')
avgEpochOverlay = joinedData.melt(id_vars='epoch', var_name='Metric', value_name='Value')
return sns.lineplot(data=avgEpochOverlay, x='epoch', y='Value', hue='Metric')
def read_files_to_dataframe(basedirectory, metric):
dataframes = []
for directory in os.listdir(basedirectory):
if( directory != 'overview.json' ):
filepath = os.path.join(os.path.join(basedirectory, directory), metric + '.txt.gz')
with gzip.open(filepath, 'rb') as f:
df = pd.read_json(f,lines=True)
df['epoch'] = int(directory.rsplit('-', 1)[-1])
dataframes.append(df)
return pd.concat(dataframes, ignore_index=True)
def readPopulationOverTime(file):
raw_df = pd.read_json(overview_file)
overview = pd.json_normalize(raw_df['worlds'])
overview['epoch'] = overview['name'].str.split('-', expand=True)[2].astype(int)
trimmed = pd.DataFrame(overview, columns=['epoch', 'totalOrganisms'])
return trimmed.iloc[::2]
|
Global Variable:
1
2
3
4
| INPUT_FILE_DIR = '/Users/luke/dev/Oracle/simulation5'
METRIC='Performance'
OVERVIEW_FILE = '/Users/luke/dev/Oracle/simulation5/overview.json'
EXPANDED_FITNESS_MAGNIFICATION = { 'startIndex': 100, 'count': 300 }
|
Global Computed Variables:
1
2
| fullSimulationDataDf = read_files_to_dataframe( INPUT_FILE_DIR, METRIC)
populationOverTimeDf = readPopulationOverTime(OVERVIEW_FILE)
|
Analysis:
1
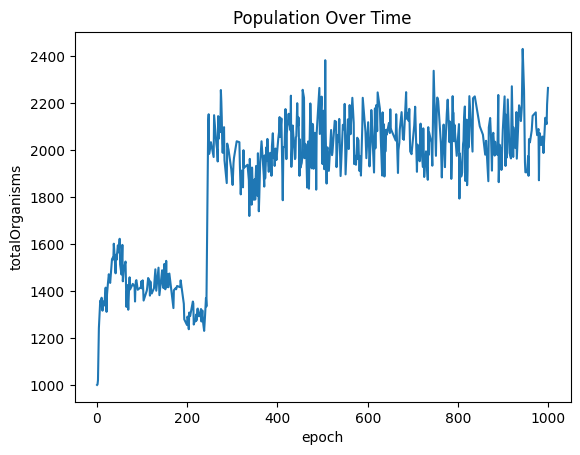
| sns.lineplot(x="epoch", y="totalOrganisms", data=populationOverTimeDf ).set_title("Population Over Time")
|
1
| Text(0.5, 1.0, 'Population Over Time')
|
1
2
| mostFitByEpochDf = fullSimulationDataDf.groupby('epoch')['fitness'].max().reset_index()
sns.lineplot(x="epoch", y="fitness", data=mostFitByEpochDf ).set_title("Most Fit Organism Fitness")
|
1
| Text(0.5, 1.0, 'Most Fit Organism Fitness')
|
1
2
3
4
| startIndex = EXPANDED_FITNESS_MAGNIFICATION['startIndex']
count = EXPANDED_FITNESS_MAGNIFICATION['count']
magnifiedDf = result.iloc[startIndex:startIndex+count]
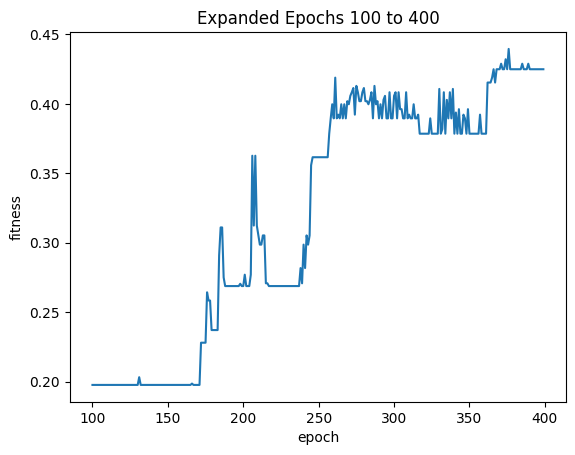
sns.lineplot(x="epoch", y="fitness", data=magnifiedDf ).set_title("Expanded Epochs " + str(startIndex) + " to " + str(startIndex+count))
|
1
| Text(0.5, 1.0, 'Expanded Epochs 100 to 400')
|
1
2
3
4
5
6
7
8
9
10
11
12
13
14
15
16
17
18
19
20
21
22
23
24
25
26
27
| fitnessHeritage = (
fullSimulationDataDf.sort_values(by='fitness', ascending=False)
.groupby('epoch')
.head(50)
)
percentages = (
fitnessHeritage.assign(
isOrigOrganism =fitnessHeritage['parentId'].eq('GOD')
)
.groupby('epoch')['isOrigOrganism']
.value_counts(normalize=True)
.unstack(fill_value=0)
.rename(columns={True: 'Initial Organisms', False: 'Organic Organisms'})
)
percentages.plot(
kind='area',
stacked=True,
figsize=(16, 8),
colormap='copper',
title='Most Fit Organisms'
)
plt.ylabel('Percentage')
plt.xlabel('Epoch')
plt.legend(title='Parent Type')
plt.show()
|
1
2
| avgFitnessByEpoch = fullSimulationDataDf.groupby('epoch', as_index=False)['fitness'].mean()
sns.lineplot(x="epoch", y="fitness", data=avgFitnessByEpoch ).set_title("Avg Fitness")
|
1
| Text(0.5, 1.0, 'Avg Fitness')
|
1
2
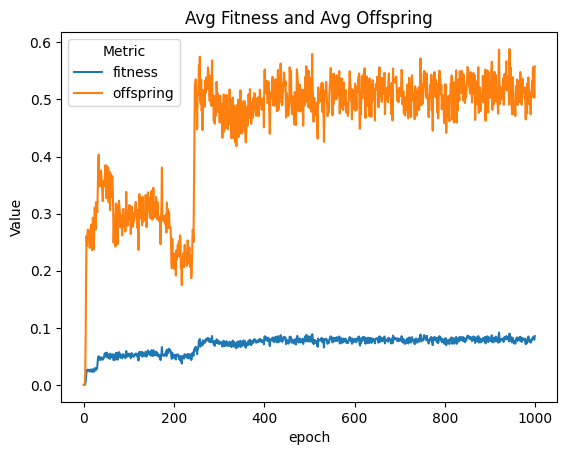
| linePlt = compareAvgMetricsByEpoch(fullSimulationDataDf, 'fitness', 'offspring')
nothing = linePlt.set_title('Avg Fitness and Avg Offspring')
|
1
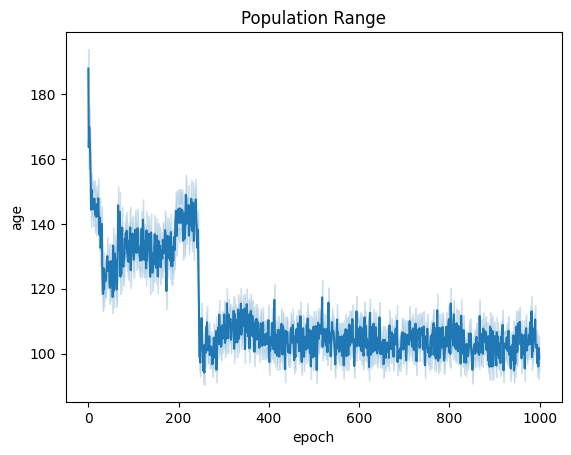
| linePlt = sns.lineplot(x="epoch", y="age", data=fullSimulationDataDf ).set_title("Population Range")
|
1
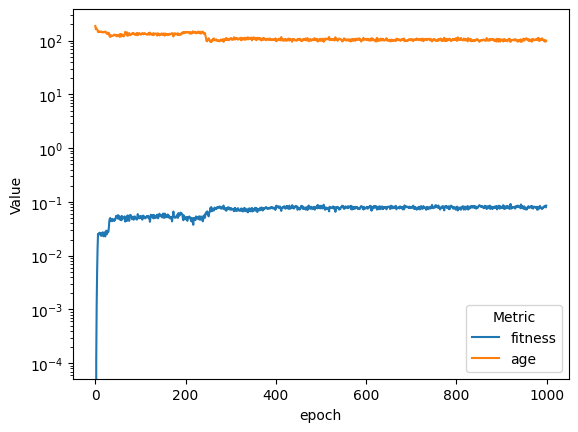
| compareAvgMetricsByEpoch(fullSimulationDataDf, 'fitness', 'age').set_yscale('log')
|
1
2
3
4
5
6
7
8
9
| linePlt = compareAvgMetricsByEpoch(fullSimulationDataDf, 'fitness', 'totalEnergyHarvested')
nothing = linePlt.set_yscale('log')
nothing = linePlt.set_title( 'Avg Energy Harvest and Avg Fitness')
nothing = linePlt.set_xlabel('Epoch')
handles, labels = linePlt.get_legend_handles_labels()
humanReadableLabels = ["Avg Energy Collected" if label == "totalEnergyHarvested" else "Fitness" for label in labels]
nothing = linePlt.legend(handles, humanReadableLabels)
|